Mississippi is leading the nation with improvements in K-12 educational outcomes and policy changes at the state level helped push the state’s students over the top.
According to the National Assessment of Educational Progress, the Magnolia State earned the top spot for fourth grade gains on reading and mathematics on the NAEP tests. It was the first time that Mississippi fourth graders earned a score higher (241) than the national average (240) in mathematics and tied the national average in reading (219).
Mississippi was the only state with measurable gains in three of four tested subjects on the tests, which are also called the nation’s report card.
Mississippi eighth graders ranked third nationally for growth in mathematics and reading in the same grade level held steady as the average dropped nationally.
In 2009, only 22 percent of fourth graders were at or above proficiency level in reading. That sparked some changes at the state level.
The Literacy-Based Promotion Act— better known as the Third Grade Reading Gate —played a large role in Mississippi’s improvement in fourth grade reading. The law was passed in 2013 and signed into law by Gov. Phil Bryant as one of his bigger educational initiatives.
The reading gate legislation mandates that third graders read at or above grade level to be promoted to the fourth grade. The bill also provides help such as reading coaches to districts with large numbers of struggling students. There are 80 MDE literacy coaches serving 182 schools statewide.
In 2019, 32 percent of fourth graders met or exceeded the reading standard.
This year, taxpayers will spend $15,094,500 on the literacy program. Last year, 36,384 third graders took the reading test, which got tougher this year, and 27,215 (74.8 percent of test takers) earned a passing or better grade on the test.
In 2018, 25,000 out of 40,500 third graders (61.73 percent) scored a passing or better grade on the reading test.
In 2009, only 22 percent of Mississippi fourth graders met or exceeded the standard on the mathematics test. Now, 39 percent of students meet that standard statewide.
Eighth graders also improved, with 25 percent of them meeting the standards in 2019 for reading after only 19 percent made the grade in 2009. Twenty four percent of Mississippi eighth graders reached or exceeded the standard for math, a nine percent improvement from 2009 (15 percent).
Mississippi is still substandard (274) for eighth grade math compared with the national average of 281. Magnolia State eighth graders averaged a grade of 256 on the reading test, still below the national average of 262. That’s still better than 2015, when Mississippi eighth graders managed only a 252.
The District of Columbia had the lowest score for eighth grade reading (250), while Alabama had the lowest score for math at 269.
Minnesota had the highest scores for fourth grade math (248), while Massachusetts (231) earned the top spot for fourth grade reading. Alaska had the lowest score for fourth grade reading (204), while Alabama fourth graders had the worst score for math (230).
Louisiana, West Virginia and New Mexico tied for next worst in math with scores of 231.
Mississippi restaurant owners who would like to allow dogs on their outside patios are now allowed to do so.
That is because of a Mississippi Department of Health rule change.
“MSDH wants to support local businesses in their efforts to best accommodate their clientele. We’ve looked at other southern states – including Georgia, Tennessee and South Carolina – and have modeled our policy after theirs,” Jim Craig, MSDH Senior Deputy and Director of Health Protection, said in a news release that was reported by the Clarion Ledger. “We assessed the health risks and identified the types of outdoor dining settings that would present low, minimal or no risk to the public.”
Earlier this year, the Clarion Ledger ran a story on pet-friendly restaurants in the Jackson metro area. The Mississippi Department of Health fired back saying that is illegal and that Mississippi code prohibits pets in restaurants, even outdoor areas.
MDH cited the Food and Drug Administration’s Food Code model, which is housed in the U.S. Department of Health and Human Services, for the prohibition. That model recommends prohibiting animals in food service establishments, save for service dogs.
The state didn't have to follow the FDA model. Indeed, many states had already legalized dogs in restaurants before Mississippi. These laws generally do two things. They often allow local governments to enact ordinances if they would like and they allow restaurants to choose whether they would like to welcome dogs on their property.
And with that, consumers can choose to bring their dog to a pet-friendly establishment, just as those who don’t like dogs can opt to go somewhere else. And the owner of the restaurant can decide what is better for his or her business.
What path a restaurant chooses isn’t as important as the restaurant having the ability to choose. But the now repealed prohibition on dogs in restaurants is just one of the more than 117,000 restrictions in the state’s regulatory code.
The biggest regulator in the state? As you would imagine, the same Department of Health that previously went after dogs in restaurants.
And why does this matter?
Regulatory growth has a detrimental effect on economic growth. We now have a history of empirical data on the relationship between regulations and economic growth. A 2013 study in the Journal of Economic Growth estimates that federal regulations have slowed the U.S. growth rate by 2 percentage points a year, going back to 1949. A recent study by the Mercatus Center estimates that federal regulations have slowed growth by 0.8 percent since 1980. If we had imposed a cap on regulations in 1980, the economy would be $4 trillion larger, or about $13,000 per person. Real numbers, and real money, indeed.
On the international side, researchers at the World Bank have estimated that countries with a lighter regulatory touch grow 2.3 percentage points faster than countries with the most burdensome regulations. And yet another study, this published by the Quarterly Journal of Economics, found that heavy regulation leads to more corruption, larger unofficial economies, and less competition, with no improvement in public or private goods.
A prescription for lowering the regulatory burden on a state is the one-in-two-out rule, or a regulatory cap. In 2017, one of President Donald Trump’s first executive orders was to require at least two prior regulations to be identified for elimination for every new regulation issued. This is badly needed. We have gone from 400,000 federal regulations in 1970 to over 1.1 million today.
Many years ago, British Columbia took on a similar mission. And in less than two decades, their regulatory requirements have decreased by 48 percent. The result has been an economic revival for the Canadian province.
Whether it’s a sunset provision, where regulations expire and must be reauthorized after a period of time, or one-in-two-out policy, Mississippi should move in the direction toward a smaller regulatory state with more freedom. And if a regulation is truly important to our well-being, let the regulators prove why.
A decision by the state to allow dogs in restaurants is a positive step but it won’t change the trajectory of the state’s economy, for better or worse. Rather, we need a deep dive into the unnecessary and outdated regulations of each agency with a goal of removing unnecessary barriers and inhibitors to economic growth.
A trend in Georgia among several fine-prone cities is also taking place in Mississippi among three cities heavily dependent on revenue from fines and forfeitures.
A recently released report by the Institute for Justice spotlighted how three Peach State cities have become dependent on fines for a larger chunk of their revenues.
Three Georgia cities — Morrow, Riverdale and Clarkston — had large jumps in terms of real dollars and percentage of revenue from fines, which can include traffic citations and code enforcement after the recession in 2009. All three also had concurrent drops in other revenues as city officials tried to use fine income to fill the shortfall.
A similar trend in Mississippi has unfolded with three of the top cities statewide in — State Line, Walls and Magee — terms of fines and forfeitures per resident. The Mississippi Center for Public Policy analyzed data from the Mississippi state Auditor’s Office and found that all three had substantial increases both in terms of percentage of revenues and total dollars in the last decade from 2008 to 2017.
State Line and Walls both had substantial drops in revenues outside of fines and forfeitures since 2008, while overall revenue in Magee has increased since 2008. Magee is a popular stopping point on Highway 49; State Line and Walls aren't as conveniently located.

State Line (population 539) is in both Greene and Wayne counties and has the highest amount of forfeitures per resident at $240.41 per resident as of 2017.
The city’s percentage of revenue from fines and forfeitures has increased in recent years.
In 2003, the city had $1,062,594 in revenue, but only $25,371 in fines and forfeitures, which represented 2.39 percent of the city’s revenues.
The biggest jump happened from 2008 to 2015. In 2008, nearly seven percent ($35,289) of the city’s $504,774 in revenues came from fines and forfeitures. By 2015, the total revenues for State Line dropped to $302,748, with $90,710 in fines and forfeitures making up a startling 29.96 percent.
In the first five years of reports, State Line averaged $722,375 in annual revenues and $33,853 from fines and forfeitures, an average of 5.63 percent.
Now the city gets a larger chunk of its revenue from its court system as tax collections have fallen. In the last three years from 2015 to 2017, the city’s revenues have decreased to an average of $361,427 with fines and forfeitures averaging $96,645. On average, fines and forfeitures have accounted for 26.34 percent of the total revenues.
Fines and forfeitures in State Line, Mississippi
| Year | Total revenue | Fines and forfeitures | % of total revenues |
| 2003 | $ 1,062,594 | $ 25,371 | 2.39% |
| 2004 | $ 1,097,810 | $ 24,711 | 2.25% |
| 2005 | $ 455,624 | $ 40,944 | 8.99% |
| 2006 | $ 501,524 | $ 40,368 | 8.05% |
| 2007 | $ 711,924 | $ 36,435 | 5.12% |
| 2008 | $ 504,774 | $ 35,289 | 6.99% |
| Averages | $ 722,375 | $ 33,853 | 5.63% |
| 2015 | $ 361,304 | $ 90,710 | 25.11% |
| 2016 | $ 319,871 | $ 69,644 | 21.77% |
| 2017 | $ 403,106 | $ 129,581 | 32.15% |
| Averages | $ 361,427 | $ 96,645 | 26.34% |
Walls is a town of (1,379 population) in DeSoto County and was ranked first in a recent study by Governing magazine which rank cities and towns nationwide on the amount of their budgets coming from fines and forfeitures. Walls ranked second with 26.53 percent of its general fund budget from fines and forfeitures in 2017. It was 19.5 percent for all revenues, including the utility fund.
Except for one outlier in 2006, when fines and forfeitures made up 19.32 percent of the city’s budget, the percentage of city revenues dependent on fines and forfeitures was in single digits.
In 2013, the percentage of the city’s revenues ($941,915) sourced from fines and forfeitures ($152,788)crossed the 15 percent threshold and hasn’t gone lower since.
Fines and forfeitures in Walls, Mississippi
| Year | Total revenue | Fines and forfeitures | % of total revenues |
| 2006 | $ 321,273 | $ 62,058 | 19.32% |
| 2007 | $ 567,846 | $ 45,207 | 7.96% |
| 2008 | $ 716,032 | $ 34,056 | 4.76% |
| 2009 | $ 591,224 | $ 24,676 | 4.17% |
| 2010 | $ 611,919 | $ 19,036 | 3.11% |
| 2011 | $ 674,900 | $ 30,589 | 4.53% |
| 2012 | $ 867,161 | $ 67,301 | 7.76% |
| 2013 | $ 941,915 | $ 152,788 | 16.22% |
| 2014 | $ 1,071,620 | $ 234,113 | 21.85% |
| 2015 | $ 1,082,216 | $ 186,136 | 17.20% |
| 2017 | $ 1,220,332 | $ 238,476 | 19.54% |
Magee was third, with its $595,238 in fines and forfeitures in 2017 adding up to $141.89 for each one of its 4,195 residents. This accounted for 12.5 percent of the Simpson County city’s $4.7 million in revenues in 2017.
In 2008, 7.06 percent of the city’s $4,224,745 in revenues came from fines and forfeitures ($298,430). By 2017, both the percentage (12.5 percent) and in total dollars ($595,238) doubled or had nearly doubled in just nine years.
Fines and forfeitures in Magee, Mississippi
| Year | Total revenue | Fines and forfeitures | % of total revenues |
| 2008 | $ 4,224,745 | $ 298,430 | 7.06% |
| 2009 | $ 4,016,212 | $ 283,760 | 7.07% |
| 2010 | $ 4,334,160 | $ 201,787 | 4.66% |
| 2011 | $ 4,264,574 | $ 230,386 | 5.40% |
| 2012 | $ 4,400,514 | $ 344,309 | 7.82% |
| 2013 | $ 4,327,099 | $ 481,415 | 11.13% |
| 2014 | $ 4,465,863 | $ 491,650 | 11.01% |
| 2015 | $ 5,539,586 | $ 504,882 | 9.11% |
| 2016 | $ 4,599,661 | $ 603,590 | 13.12% |
| 2017 | $ 4,761,865 | $ 595,238 | 12.50% |
Families who homeschool or send their children to private school provide a savings of more than $340 million to taxpayers. And that doesn’t even include local or federal savings, which likely doubles that number.
The state appropriated more than $2.58 billion for K-12 education this past year. This includes MAEP, general education programs, education enhancement funds, and a couple other programs. Last year, 470,000 students attended public schools, a number that will likely decrease when final enrollment numbers are released later this year.
That translates to an average of $5,500 per student, though those numbers vary.
While we don’t have ‘official’ numbers on private school students or homeschoolers, estimates based on national data and Census numbers, generally put the numbers in the range of 40,000-50,000 students in private school and 15,000-20,000 who homeschool.
Using the middle number for homeschool and private school students, those families save the state approximately $343 million. That number would be higher if we took into account local and federal funds, that make up a little less than half education funding in the state.
No tax credits or deductions
Nine programs in eight states allow families to receive individual tax credits and deductions for approved educational expenses, including private school tuition, books, supplies, computers, tutors, and transportation. Tax credits lower the total taxes a person owes; a deduction reduces a person’s total taxable income.
The credits and deductions a family could receive differ among the states. Eligibility to participate also varies.
| State | Program | Individual Credit/ Deduction Cap |
| Alabama | Alabama Accountability Act of 2013 Parent-Taxpayer Refundable Tax Credits | 80% per pupil funding |
| Illinois | Tax Credits for Educational Expenses | $750 |
| Indiana | Private School/Homeschool Deduction | $1,000 |
| Iowa | Tuition and Textbook Tax Credit | $250 |
| Louisiana | Elementary and Secondary School Tuition Deduction | $5,000 per student |
| Minnesota | Education Deduction | $1,625 to $2,500 |
| Minnesota | K–12 Education Credit | $1,000 per student |
| South Carolina | Refundable Educational Credit for Exceptional Needs Children | $11,000 per student |
| Wisconsin | K–12 Private School Tuition Deduction | $4,000 to $10,000 |
Source: EdChoice
Mississippi provides no credit or deduction for private or homeschool families.
Gov. Phil Bryant is ending the last two months of his time in the governor’s mansion with approval ratings that are among the highest in the country.
According to Morning Consult’s gubernatorial approval rankings from the third quarter of 2019, Bryant has a 55 percent approval rating compared to just 26 percent of voters who disapprove, a positive spread of 29 points.
The 55-26 rating is good for 14th highest overall. The main difference is the majority of the governor’s ahead of Bryant have been in office for one full term or less. Bryant, of course, is wrapping up his eighth and final year.
In his two elections, Bryant set modern day high marks for Republican gubernatorial candidates. He won 61 percent of the vote against then-Hattiesburg Mayor Johnny DuPree in 2011, while winning 66 percent in 2015 against Robert Gray, a truck driver who was the surprise Democrat nominee four years ago.
About the survey
On a daily basis, Morning Consult surveys over 5,000 registered voters across the United States. Morning Consult conducted 533,985 surveys with registered U.S. voters from July 1 through September 30, 2019, to determine the Q3 2019 Governor Rankings.
The margins of error vary by state and party. You can see the margin of error for each governor here.
In each poll, Americans indicated whether they approve or disapprove of the job performance of their governor. For each question, they could answer strongly approve, somewhat approve, somewhat disapprove, strongly disapprove, or don’t know / no opinion.
Morning Consult obtained population parameters for registered voters from the November 2012 Current Population Survey.
Mississippi’s tax climate dipped slightly last year as it remains in the both half nationally.
The Tax Foundation placed Mississippi 31st overall for taxes, including corporate, individual, sales, property, and unemployment insurance taxes. The only neighboring state to do better was Tennessee. Alabama, Louisiana, and Arkansas were rated 40, 41, and 46 respectively.
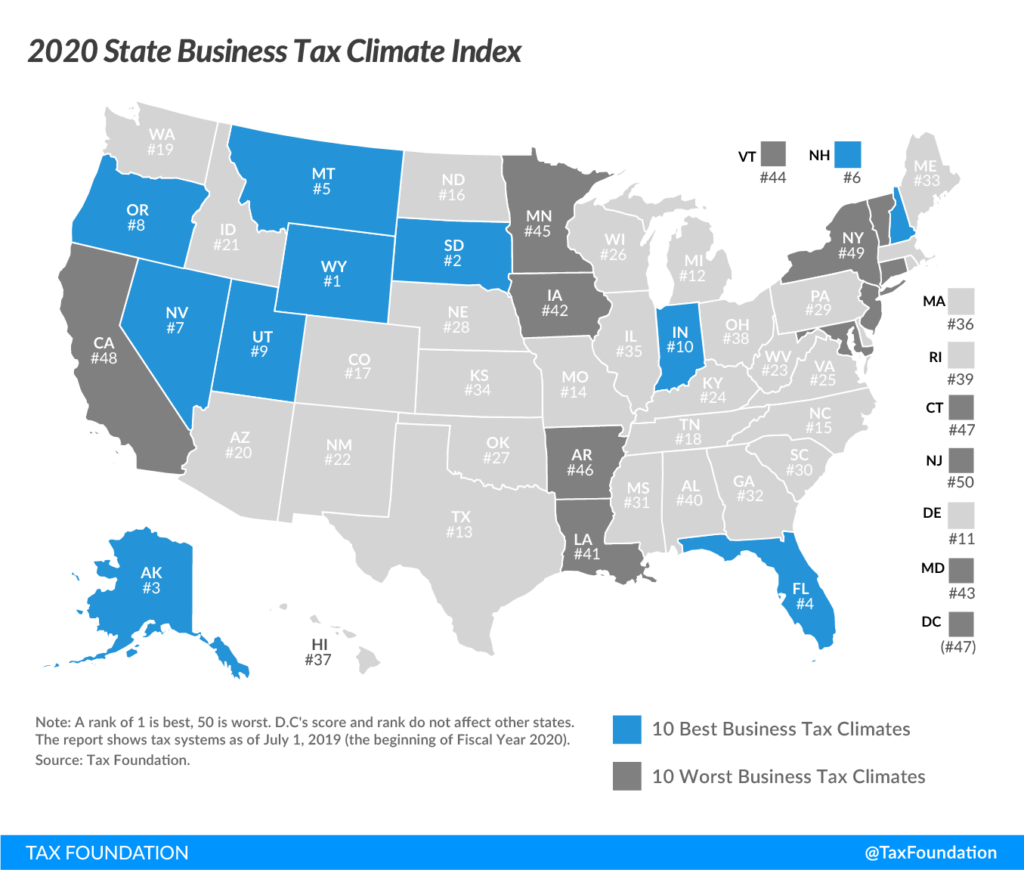
Wyoming was again the top-rated state, followed by South Dakota, Alaska, Florida, and Montana. The bottom five states, beginning with number 50, were New Jersey, New York, California, Washington, D.C., and Connecticut.
According to the Tax Foundation, the top states share a few similarities.
“The absence of a major tax is a common factor among many of the top 10 states,” according to the report. “Property taxes and unemployment insurance taxes are levied in every state, but there are several states that do without one or more of the major taxes: the corporate income tax, the individual income tax, or the sales tax. Wyoming, Nevada, and South Dakota have no corporate or individual income tax (though Nevada imposes gross receipts taxes); Alaska has no individual income or state-level sales tax; Florida has no individual income tax; and New Hampshire, Montana, and Oregon have no sales tax.”
Mississippi dropped a spot from last year. The state received its best marks for unemployment taxes (5th best) and corporate taxes (10th best). The corporate tax component measures impacts of states’ major taxes on business activities, both corporate income and gross receipts taxes. The unemployment insurance tax component measures the impact of state UI tax attributes, from schedules to charging methods, on businesses.
Mississippi’s worst tax categories were property and sales. It would be a good idea to lower our business tax burden on land, buildings, equipment, and inventory.
Mississippi has begun phasing out its capital stock tax, following an exemption added in 2018 with the first-rate reduction, from 2.5 to 2.25 mills, in 2019. The tax will slowly phase out through 2028, but the modest rate reduction is not enough to move the needle on Index rankings.
Voters in the Leland School District rejected a bond measure in September when it failed to receive the necessary 60 percent of the vote for approval. The Leland School Board has set December 10 for a re-vote.
The price of the bond to taxpayers will decrease from $8.75 million to $6.9 million, according to the Leland Progress.
While some have used this to decry the crumbling facilities or complain about state funding, one major issue should be addressed before moving to others: The district had 776 students last year.
That’s the size of a high school, or maybe one school, but you shouldn’t be expected to run and finance a school district of that size in a poor part of the state with little infrastructure.
Because as some talk about the challenges the district faces, this school district spends among the most per student in the state. According to the last audit of the district, it spent $13,523 per student. The state provides about 57 percent of funding for the district.
The cost per student and the state’s share of funding is considerably more than districts like Madison, Clinton, or Rankin.
It’s also considerably more than tuition at nearby private schools: Washington School is $6,792 for high school, it’s $5,395 (for Catholic students) and $6,395 (for non-Catholic students) at St. Joseph Catholic School, $5,775 at Indianola Academy, and $5,600 at Greenville Christian School. And I am guessing they don’t have problems with leaking roofs or air conditioning despite being about half the price.
Washington county’s population is about 46,000. It was over 72,000 in 1980. But it’s still home to four school districts. The Greenville School District is the largest with about 5,000 students. But you then have Western Line School District, with 1,851 students, the tiny Hollandale School District, with 581 students, and Leland.
Washington county school districts
| District | Students | Cost per student |
| Greenville School District | 4,955 | $9,367 |
| Hollandale School District | 581 | $12,740 |
| Leland School District | 776 | $13,523 |
| Western Line School District | 1,851 | $10,641 |
Over the past eight years, the state legislature has adopted 10 separate consolidation bills impacting 21 different school districts. By 2021, the state will have 13 fewer school districts than in 2014.
Washington county has yet to be part of that mix. Local residents may love their local school districts. Local legislators will continue to fight as hard as they can. And a bond, if successful, will be funded by those local residents.
However, at the end of the day, the school district gets the majority of its money from the state, meaning taxpayers throughout the state, not just Leland residents. And taxpayers have a right to know if their money is being spent wisely. A consistently underperforming school district with 776 kids that spends over $13,000 per student? I don’t know if that should be considered wise, especially when there are other options.
Mississippi’s school districts are inefficient compared to other Southern states
The issue isn’t just Leland. School districts in Mississippi serve a lower number of students, on average, than every other state in the Southeast, save for Arkansas. What does that mean? We are spending money on additional salaries, pensions, benefits, buildings, etc. that other states are not. This means less money in the classrooms.
| State | Total enrollment | Total school districts | Students per district |
| Florida | 2,721,459 | 67 | 40,619 |
| North Carolina | 1,443,163 | 115 | 12,549 |
| Virginia | 1,279,544 | 135 | 9,478 |
| Georgia | 1,744,240 | 199 | 8,765 |
| South Carolina | 718,322 | 82 | 8,760 |
| Tennessee | 960,704 | 142 | 6,766 |
| Louisiana | 720,458 | 126 | 5,718 |
| Alabama | 733,951 | 136 | 5,397 |
| West Virginia | 281,439 | 55 | 5,117 |
| Kentucky | 685,176 | 173 | 3,961 |
| Mississippi | 492,279 | 151* | 3,260 |
| Arkansas | 475,782 | 254 | 1,873 |
Source: National Education Association, “Rankings & Estimates 2014-2015”
The average district size among the 12 states was 9,467, almost three times the size of the average district in Mississippi. For Mississippi to be in line with that average, the state would need to see a reduction to 52 school districts, eliminating almost two-thirds of the districts in the state.
Florida is the biggest outlier in this group. Removing the Sunshine State from the mix would drop the average district size to 6,513. Even doing that, Mississippi would still need to drop to 75 districts to be at the average. That is a reduction of almost 50 percent.
Among neighboring states, if school districts in Mississippi were to serve the same number of students as school districts in Alabama, Mississippi would need to experience a reduction to 91 districts. To mirror Louisiana, Mississippi would need a reduction to 86 districts. And to match the same number of students per district as Tennessee, Mississippi would need a reduction to 73 districts. Either of these changes would represent a decrease of 40 to 50 percent of the districts in the state.
Additionally, the districts in Mississippi are largely unbalanced. Half of all public school students in the state attend school in one of just 28 school districts. Yet, 63 districts have less than 2,000 students and educate just 16 percent of students.
There is not a magic size for a district. There are poor performing large districts, starting with Jackson Public Schools, just as there are high-performing small districts. But this inefficient distribution of students, which results in excessive bureaucracy, costs taxpayers money and prevents dollars from making it to the classroom.
While there is overwhelming local pressure to oppose consolidation, the legislature should continue with the process of protecting taxpayer dollars and reducing the number of school districts in Mississippi.
As children in Mississippi and around the country prepare for a night of trick-or-treating, they may unknowingly run afoul with local laws.
These aren’t laws restricting criminal actions often associated with Halloween mischief, such as egging a house or smashing pumpkins that belong to someone else. Rather, these are restrictions on who can trick-or-treat, how late they can be out, and what they can or can’t wear.
A story on Roanoke, Virginia’s trick-or-treating laws went viral last year. In Roanoke, no one over 12 is allowed to trick-or-treat. Not only is it illegal, it is a misdemeanor punishable by up to six months in jail.
While the potential jail time might not apply, the city of Meridian also prohibits those over 12 from asking for candy. “It shall be unlawful for any person to appear on the streets, highways, public homes, private homes, or public places in the city to make trick or treat visitations; except, that this section shall not apply to children 12 years old and under on Halloween night,” the ordinance reads. And you have to be inside by 8 p.m.
Throughout the country, towns like Belville, Illinois, Bishopville, South Carolina, and Boonsboro, Maryland have similar age limits.
Meridian also restricts anyone over 12 from wearing a mask or any other disguise, unless they get a permission slip from the mayor or chief of police. Dublin, Georgia and Walnut Creek, California have similar mask restrictions.
The rest of your costume may also be illegal in some locales. In Alabama, it’s illegal to dress up as a minister, priest, nun, or any other member of clergy. Violators can be slapped with a $500 fine and a year in jail.
In a recent move that received national attention, the Kemper County Board of Supervisors approved a measure in 2016 that made it illegal for anyone to appear in public in a clown costume or clown makeup for Halloween that year. The ordinance expired the day after Halloween. That ordinance carried a fine of $150 for outlaws who wore clown costumes.
The conventional wisdom is that these ordinances aren’t enforced. Police aren’t asking boys who are starting to show signs of facial hair for identification to check their age. Chances are no one is spending 365 days in a county jail in Alabama for impersonating a priest or rabbi.
Which, of course, leads to the next question: Why have such laws? We already have laws on the books to restrict actual criminal activity. We don’t need additional laws that are confusing and do little but potentially ruin a fun night for millions of children.
We simply have too many laws in this country. It should not be government’s responsibility to regulate the behavior of children on a Halloween night running through the neighborhood in pursuit of treats. That responsibility belongs to the parents, just like it should on every other night of the year.