A report by a legislative watchdog says the Tunica County Board of Supervisors needs reforms to its procedures to ensure that it doesn’t engage in deficit spending and complies with state law on various issues.
The Joint Legislative Committee on Performance Evaluation and Expenditure Review (PEER Committee) issued the report in light of budgetary concerns that included:
- A $4.3 million deficit from October 1, 2012 to August 31, 2019.
- The county’s general fund had a negative balance of $4.9 million and the report says the county was using its road fund to pay expenses in contravention of state law.
- In April 2018, the board transferred $5 million to the general fund from its road funds, a practice also contrary to state law. An opinion from the attorney general informed the board that the transfer wasn’t permissible, but the board didn’t authorize repayment of the $5 million to the road fund until PEER began its investigation.
- The county assessed a nine-mill property tax for the road fund in 2015 and overtaxed county residents by $5.5 million from 2015 to 2017 because it was inaccurate in its projection of future road maintenance and construction expenditures.
- Minutes of the board’s meetings didn’t always specify why the body went into executive session as required by law.
- In fiscal 2014, the county was forced by a court order to refund $190,000 to one taxpayer after being in non-compliance with state law on the issuance of tax levies.
Tunica County revenues declined because of declining gaming fee expenses, falling 26 percent between 2013 and 2018. The county received 62 percent of its revenues during the same span from gaming fees.
The county has six casinos, down from a high of nine in 2014.
The report says there are also problems with the way the county spends taxpayer funds.
The board has an arrangement with the North Delta Regional Housing Authority on a program to build and rehabilitate homes in the county for the elderly and handicapped, but had no signed contract either between the NDRHA and the county.
The county later moved all administrative and operational responsibilities for the program to the non-profit Tunica County Housing Inc. in 2014.
The board voted to appropriate $1.6 million from county taxpayers to the organization, with no supporting documentation on how the funds were expended or whether any work. The Tunica County Housing Inc., which was involved in the program, spent 41 percent of its budget ($681,000) provided by taxpayers on administrative costs.
The Better Business Bureau and the Charities Review Council both agree that administrative costs shouldn’t exceed 35 percent for a grant-issuing organization.
The county’s attorney, John Keith Perry Jr., blasted the report in his response letter that PEER includes from examined agency or subdivision.
He said that county officials only had two “small windows of four hours” to review and respond to the PEER report, less than what had been given to other agencies in the past. He also accused PEER of being focused on “a few hot-button issues of a political nature.”
He also said the county reserves the right to do a more thorough response when allowed to study the full and final report.
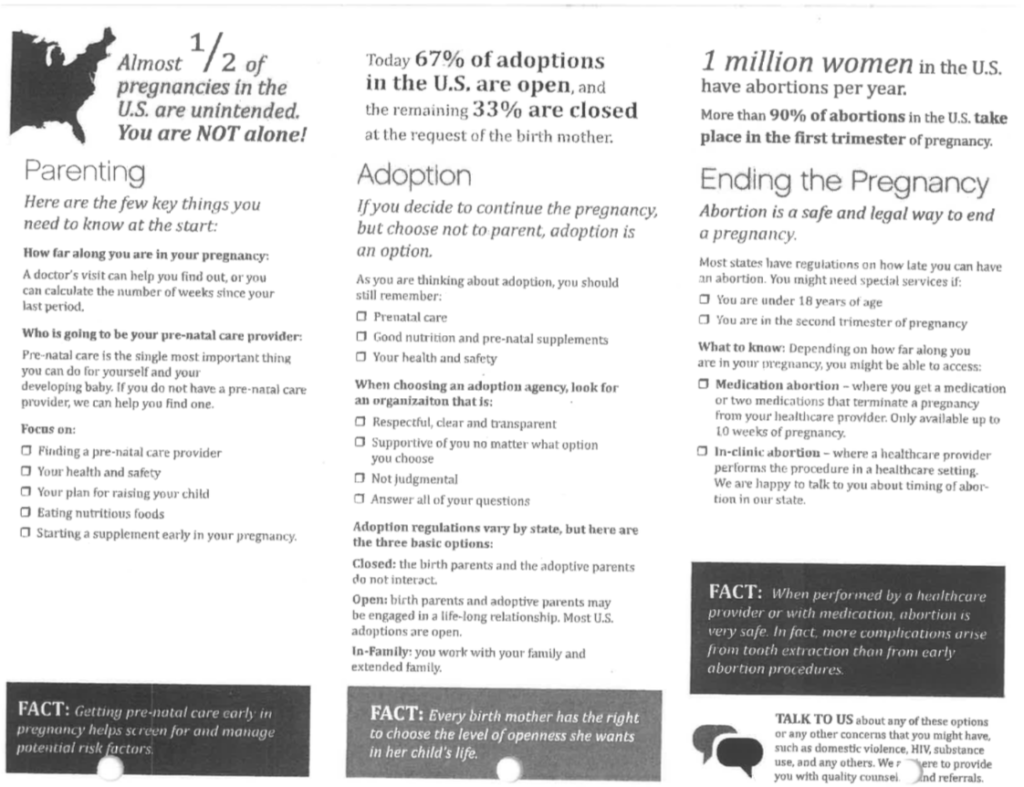
Officials from a pro-abortion group working with the Mississippi state Department of Health offered to give county health clinics a free iPad for encouraging participation by pregnant women in a study, who also received a participation gift.
Provide Inc. is a Cambridge, Massachusetts-based pro-abortion group that was brought in by former State Health Officer Dr. Mary Currier in June 2017 to get the state in compliance with mandates regarding Title X, a federal family planning program that provided the state with more than $10 million over the past two years.
These Title X mandates included options counseling, which included abortion, for pregnant women using services at county clinics.
The Provide survey was intended to gather data for MDH and the pro-abortion group on services received, quality of option counseling (which included abortion) and demographics. The survey began on April 19, 2018 and was closed on June 20 after a federal court decision.
The study was conducted on iPads exclusively loaded with the survey materials and provided to 14 clinics statewide. The goal was for Provide and MDH to survey 400 pregnant women. The clinics would get to permanently keep their iPad if they got an 85 percent completion rate.
According to the last data from the emails obtained by the Mississippi Center for Public Policy, 345 women completed the survey.
The pregnant women received a $15 gift card to Target for participating in the survey on the iPad. If they agreed to do an interview with a Provide staffer two weeks later, they received a $40 gift card.
According to an email, Provide intended to use the data to further its training program, while the MDH’s goal was to determine if Provide training helped with options counseling for pregnant women. The survey was aimed at adult, English-speaking pregnant women, with non-English speakers and minors excluded.
On April 25, State Health Officer Dr. Thomas Dobbs told his employees to “remove all educational material samples left by the group Provide.” He later said that some of the materials were seen at a local county health department and that they weren’t approved for use at MDH.
He gave instructions that all Provide materials were to be removed by May 1 and that any found were to be reported.
One of his subordinates told him and other officials that Provide held training in Jackson and that some of those employees at the training were provided some materials on site as resources.
On May 6, a 16-year-old pregnant girl completed the survey in Rankin County and received a gift card. Provide removed her information from the survey and the clinic received additional training in eligibility screening.
State officials, most notably Marilyn Johnson, who is the MDH’s director of Family Planning and Title V Maternal Child Health, were in constant contact with Provide employees during the study period providing updates on study participant numbers.
There are several reminders to the participating clinics that Provide materials were not approved by the MDH. Other emails requested the charging of iPads. One clinic director was asked if she was refusing to participate in survey and Provide employees wondered if someone else at the clinic could do it instead.
MDH received $4,522,634 in fiscal 2019, $5,520,200 in fiscal 2020 and will likely receive $4,100,000 in fiscal 2021 from the Title X grant program.
According to its 2018 IRS Form 990 tax form, Provide “focuses on making sustainable improvements to abortion access where it is needed most in rural communities in the South and Midwest.”
The group said in the 990 that it held training sessions at 630 health and social service sites in states where “women seeking abortion face particularly high barriers to accessing care.” The organization also said that its goal was to increase “trainees’ intention to provide referral for abortion by 69 percent.”
The states listed, in addition to Mississippi, included Alabama, Colorado, Florida, Illinois, Kentucky, Louisiana, North Carolina, Nebraska, New York, Ohio, Oklahoma and Tennessee.
The 9th Circuit of the U.S. Court of Appeals issued a stay on the injunctions on the Trump administration rule, allowing it to go into effect, while it considers the merits of the legal challenges. Oral arguments in the case were held on September 23.
Planned Parenthood has pulled out of the Title X program as a result of the new rule.
Mississippi’s tax climate dipped slightly last year as it remains in the both half nationally.
The Tax Foundation placed Mississippi 31st overall for taxes, including corporate, individual, sales, property, and unemployment insurance taxes. The only neighboring state to do better was Tennessee. Alabama, Louisiana, and Arkansas were rated 40, 41, and 46 respectively.
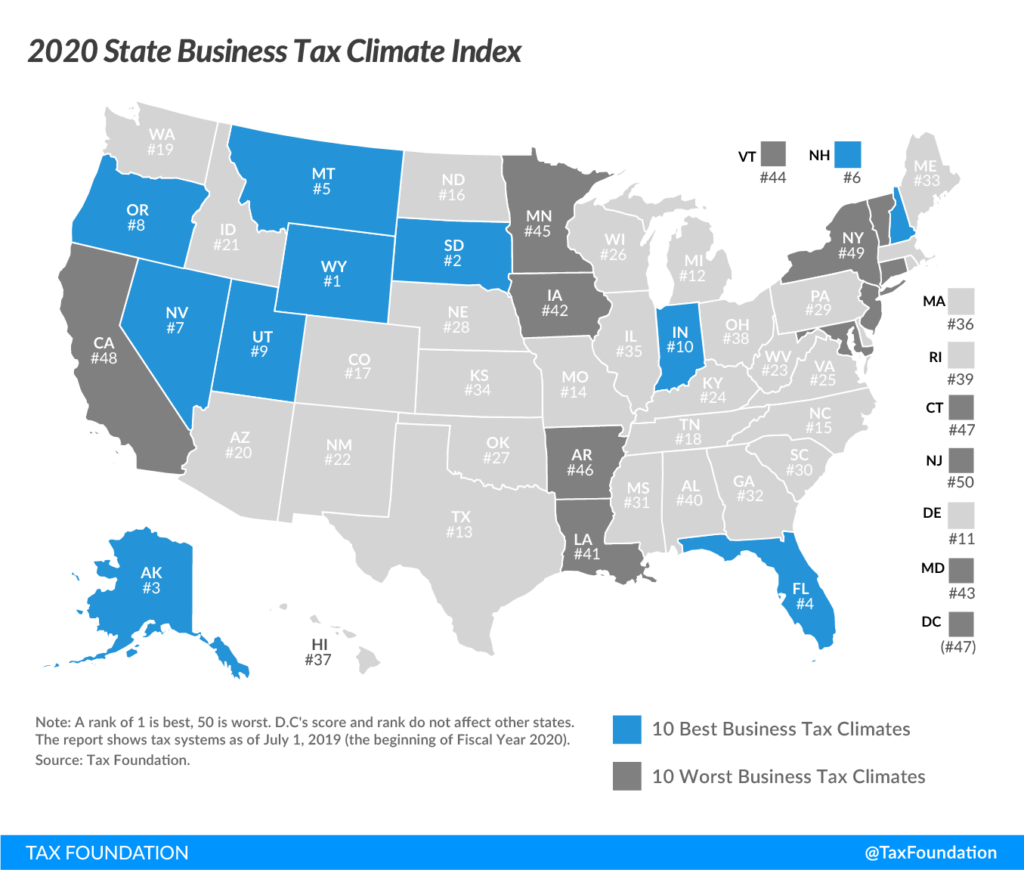
Wyoming was again the top-rated state, followed by South Dakota, Alaska, Florida, and Montana. The bottom five states, beginning with number 50, were New Jersey, New York, California, Washington, D.C., and Connecticut.
According to the Tax Foundation, the top states share a few similarities.
“The absence of a major tax is a common factor among many of the top 10 states,” according to the report. “Property taxes and unemployment insurance taxes are levied in every state, but there are several states that do without one or more of the major taxes: the corporate income tax, the individual income tax, or the sales tax. Wyoming, Nevada, and South Dakota have no corporate or individual income tax (though Nevada imposes gross receipts taxes); Alaska has no individual income or state-level sales tax; Florida has no individual income tax; and New Hampshire, Montana, and Oregon have no sales tax.”
Mississippi dropped a spot from last year. The state received its best marks for unemployment taxes (5th best) and corporate taxes (10th best). The corporate tax component measures impacts of states’ major taxes on business activities, both corporate income and gross receipts taxes. The unemployment insurance tax component measures the impact of state UI tax attributes, from schedules to charging methods, on businesses.
Mississippi’s worst tax categories were property and sales. It would be a good idea to lower our business tax burden on land, buildings, equipment, and inventory.
Mississippi has begun phasing out its capital stock tax, following an exemption added in 2018 with the first-rate reduction, from 2.5 to 2.25 mills, in 2019. The tax will slowly phase out through 2028, but the modest rate reduction is not enough to move the needle on Index rankings.
Voters in the Leland School District rejected a bond measure in September when it failed to receive the necessary 60 percent of the vote for approval. The Leland School Board has set December 10 for a re-vote.
The price of the bond to taxpayers will decrease from $8.75 million to $6.9 million, according to the Leland Progress.
While some have used this to decry the crumbling facilities or complain about state funding, one major issue should be addressed before moving to others: The district had 776 students last year.
That’s the size of a high school, or maybe one school, but you shouldn’t be expected to run and finance a school district of that size in a poor part of the state with little infrastructure.
Because as some talk about the challenges the district faces, this school district spends among the most per student in the state. According to the last audit of the district, it spent $13,523 per student. The state provides about 57 percent of funding for the district.
The cost per student and the state’s share of funding is considerably more than districts like Madison, Clinton, or Rankin.
It’s also considerably more than tuition at nearby private schools: Washington School is $6,792 for high school, it’s $5,395 (for Catholic students) and $6,395 (for non-Catholic students) at St. Joseph Catholic School, $5,775 at Indianola Academy, and $5,600 at Greenville Christian School. And I am guessing they don’t have problems with leaking roofs or air conditioning despite being about half the price.
Washington county’s population is about 46,000. It was over 72,000 in 1980. But it’s still home to four school districts. The Greenville School District is the largest with about 5,000 students. But you then have Western Line School District, with 1,851 students, the tiny Hollandale School District, with 581 students, and Leland.
Washington county school districts
| District | Students | Cost per student |
| Greenville School District | 4,955 | $9,367 |
| Hollandale School District | 581 | $12,740 |
| Leland School District | 776 | $13,523 |
| Western Line School District | 1,851 | $10,641 |
Over the past eight years, the state legislature has adopted 10 separate consolidation bills impacting 21 different school districts. By 2021, the state will have 13 fewer school districts than in 2014.
Washington county has yet to be part of that mix. Local residents may love their local school districts. Local legislators will continue to fight as hard as they can. And a bond, if successful, will be funded by those local residents.
However, at the end of the day, the school district gets the majority of its money from the state, meaning taxpayers throughout the state, not just Leland residents. And taxpayers have a right to know if their money is being spent wisely. A consistently underperforming school district with 776 kids that spends over $13,000 per student? I don’t know if that should be considered wise, especially when there are other options.
Mississippi’s school districts are inefficient compared to other Southern states
The issue isn’t just Leland. School districts in Mississippi serve a lower number of students, on average, than every other state in the Southeast, save for Arkansas. What does that mean? We are spending money on additional salaries, pensions, benefits, buildings, etc. that other states are not. This means less money in the classrooms.
| State | Total enrollment | Total school districts | Students per district |
| Florida | 2,721,459 | 67 | 40,619 |
| North Carolina | 1,443,163 | 115 | 12,549 |
| Virginia | 1,279,544 | 135 | 9,478 |
| Georgia | 1,744,240 | 199 | 8,765 |
| South Carolina | 718,322 | 82 | 8,760 |
| Tennessee | 960,704 | 142 | 6,766 |
| Louisiana | 720,458 | 126 | 5,718 |
| Alabama | 733,951 | 136 | 5,397 |
| West Virginia | 281,439 | 55 | 5,117 |
| Kentucky | 685,176 | 173 | 3,961 |
| Mississippi | 492,279 | 151* | 3,260 |
| Arkansas | 475,782 | 254 | 1,873 |
Source: National Education Association, “Rankings & Estimates 2014-2015”
The average district size among the 12 states was 9,467, almost three times the size of the average district in Mississippi. For Mississippi to be in line with that average, the state would need to see a reduction to 52 school districts, eliminating almost two-thirds of the districts in the state.
Florida is the biggest outlier in this group. Removing the Sunshine State from the mix would drop the average district size to 6,513. Even doing that, Mississippi would still need to drop to 75 districts to be at the average. That is a reduction of almost 50 percent.
Among neighboring states, if school districts in Mississippi were to serve the same number of students as school districts in Alabama, Mississippi would need to experience a reduction to 91 districts. To mirror Louisiana, Mississippi would need a reduction to 86 districts. And to match the same number of students per district as Tennessee, Mississippi would need a reduction to 73 districts. Either of these changes would represent a decrease of 40 to 50 percent of the districts in the state.
Additionally, the districts in Mississippi are largely unbalanced. Half of all public school students in the state attend school in one of just 28 school districts. Yet, 63 districts have less than 2,000 students and educate just 16 percent of students.
There is not a magic size for a district. There are poor performing large districts, starting with Jackson Public Schools, just as there are high-performing small districts. But this inefficient distribution of students, which results in excessive bureaucracy, costs taxpayers money and prevents dollars from making it to the classroom.
While there is overwhelming local pressure to oppose consolidation, the legislature should continue with the process of protecting taxpayer dollars and reducing the number of school districts in Mississippi.
The Mississippi Department of Health worked with a pro-abortion group to distribute literature and helped the non-profit perform a voluntary study on pregnant women at 14 county health clinics around the state.
In an August 9 letter requested by state Sen. Angela Hill (R-Picayune) to the legislature’s watchdog, known as the Joint Legislative Committee on Performance Evaluation and Expenditure Review or PEER Committee, the Mississippi Department of Health detailed its relationship with the non-profit Provide, a pro-abortion group.
According to Guidestar, a non-partisan charity monitoring group, Provide’s mission is ensuring access to safe abortion for all women in the United States.
Provide was involved to assist the MDH with compliance with the requirements of a $286 million federal family planning program called Title X. In June 2017, the U.S. Department of Health and Human Services conducted a site visit and found the state not in compliance with requirements for options counseling, which included abortion.
According to the letter, Provide gave training to MDH employees in late 2017 and early 2018 to facilitate implementation of a corrective action plan. There were no contracts between state officials and Provide, according to an examination of the state contract database.
In addition to training, Provide was approved by the Institutional Review Board to issue several iPads loaded with a voluntary client survey to several county health clinics statewide. The survey was intended to gather data on services received, quality of option counseling (which included abortion) and demographics.
In an August 9 letter to the PEER Committee, MDH claimed that no publication or information from Provide was used to counsel patients.
That response contradicts one email from MDH.
In one email sent on April 25, State Health Officer Dr. Thomas Dobbs said that he had ordered the Provide educational materials from county health clinics removed months ago. He also said several complaints had been received about some clinics still having the material on hand. He ordered them to have the materials removed by May 1.
According to its 2018 IRS Form 990 tax form, Provide is a Cambridge, Massachusetts-based 501 (c)(3) group that “focuses on making sustainable improvements to abortion access where it is needed most in rural communities in the South and Midwest.”
The group said in the 990 that it held training sessions at 630 health and social service sites in states where “women seeking abortion face particularly high barriers to accessing care.” The organization also said that its goal was to increase “trainees’ intention to provide referral for abortion by 69 percent.”
The states listed, in addition to Mississippi, included Alabama, Colorado, Florida, Illinois, Kentucky, Louisiana, North Carolina, Nebraska, New York, Ohio, Oklahoma, and Tennessee.
Provide’s involvement with the MDH was ended because of a rule change in the Title X program by the Trump administration. The new rule which prohibited grant money going to programs where abortions are performed.
On June 20, the 9th Circuit of the U.S. Court of Appeals granted the Department of Health and Human Services’ request for a stay on several injunctions issued by district courts in three states that temporarily halted the Trump administration’s new rule. MDH stopped the study the same day.
The entire 9thCircuit is taking up the case and oral arguments were held on September 23, with a decision likely forthcoming.
MDH/Provide timeline
- June 2017 – After a site visit by the U.S. Department of Health and Human Services, the state is found not to be in compliance with Title X regulations regarding option counseling (including abortions).
- Last quarter of 2017 and first quarter of 2018 – Pro-abortion group Provide helps train state officials and county health department workers in options counseling.
- April 19, 2018 – Study conducted by Provide on options counseling administered voluntarily to pregnant women using services at several county health clinics begins.
- February 2019 – The Trump administration issues a new Title X rule that prohibits the provision of grant money to abortion providers.
- April 25, 2019 – Dr. Dobbs instructs MDH employees to not hand out Provide educational materials since they aren’t state-approved.
- June 20, 2019 – The state ends the Provide study after a decision by the 9thCircuit of the U.S. Court of Appeals keeps the Trump Title X rules in effect.
Mississippi has more than 117,000 regulations on the books. It would take the average person 13 weeks to wade through the 9 million words of administrative code on record.
This data is from the Mercatus Center at George Mason University. They have been combing through the data on regulations among the 50 states. For various reasons they were only able to get results from 46 states, but it does provide a picture of what everyone is doing.
So what do we know?
Virtually every state has a regulatory problem. The average state has 131,000 regulations, putting Mississippi slightly below the average. But the bigger you are, the more regulated you are.
The most regulated state is California, which would come as a surprise to very few people. It has nearly 400,000 regulations. The other states in the top five are New York, Illinois, Ohio, and Texas.
South Dakota, Alaska, Montana, Idaho, and North Dakota are the least regulated. South Dakota had just 44,000 regulatory restrictions. Idaho, who is in the middle of a population boom, is the largest state among that group with about 1.7 million residents.
Why do we care?
Regulatory growth has a detrimental effect on economic growth. We now have a history of empirical data on the relationship between regulations and economic growth. A 2013 study in the Journal of Economic Growth estimates that federal regulations have slowed the U.S. growth rate by 2 percentage points a year, going back to 1949.
A recent study by the Mercatus Center estimates that federal regulations have slowed growth by 0.8 percent since 1980. If we had imposed a cap on regulations in 1980, the economy would be $4 trillion larger, or about $13,000 per person. Real numbers, and real money, indeed.
On the international side, researchers at the World Bank have estimated that countries with a lighter regulatory touch grow 2.3 percentage points faster than countries with the most burdensome regulations. And yet another study, this published by the Quarterly Journal of Economics, found that heavy regulation leads to more corruption, larger unofficial economies, and less competition, with no improvement in public or private goods.
Mississippi’s regulatory burden, by agency
| Agency | Regulations |
| Department of Health | 20,248 |
| Department of Human Services | 12,530 |
| State Boards, Commission, and Examiners | 10,204 |
| Department of Environmental Quality | 9,158 |
| Department of Mental Health | 6,006 |
There are actions a state can take to free their citizens of this burden. One of the most common reforms is the one-in-two-out rule where every time a new regulation is added to the books, two must be removed by that agency or department. Similarly, sunset provisions require the legislature to determine whether a regulation is necessary and if it should remain.
Currently, regulations are written in the code and stay on the books in perpetuity. That isn’t good.
Simply because Mississippi is closer to the middle (rather than being among the worst) does not mean the state should be comfortable with our regulatory burden. In a state in need of economic growth, rather, we should find a way to remove unnecessary barriers and inhibitors.
Taxpayers are providing the funding for a seminar this week in Hattiesburg that features an education professor who co-wrote a book with Bill Ayers, the controversial Weather Underground radical leader and education professor.
According to Mississippi Department of Education spokeswoman Patrice Guilfoyle, Crystal Laura will be paid $5,000, plus travel costs, from federal funds. Laura will be one of the keynote speakers at Transforming Schools: Meeting the Needs of All Learners workshop that started Tuesday and ends Wednesday in Hattiesburg.
Laura, who is an assistant professor of educational leadership at Chicago State University, cowrote You Can’t Fire the Bad Ones! And 18 Other Myths about Teachers, Teachers Unions and Public Education with Ayers in 2018 and has written other books, including Being Bad: My Baby Brother and the School-to-Prison Pipeline in 2014.
The event is designed for educators from districts identified by MDE as at-risk and require more professional development, additional funding, and other assistance.
This program is part of the Every Student Succeeds Act that was signed into law by President Obama in 2015.
The event was sponsored by the MDE and the Mississippi State University Research and Curriculum Unit.
Laura’s seminar was to instruct seminar participants on the “equitable literacy skills required for Mississippi educators to better support the learning needs of vulnerable and/or minority students.” This would help educators attending the seminar “build their capacity to provide equitable and culturally responsive teaching.”
The other keynote speaker is Robert Jackson, a former NFL player and former teacher in the Indianapolis Public Schools. His session dealt with strategies for educating black and Latino males.
Ayers is a retired University of Illinois at Chicago professor and was the former leader of the Weather Underground. This leftwing domestic terror organization from the late 1960s and early 1970s performed bombings of the U.S. Capitol and the Pentagon in addition to other targets in New York and Chicago.
Thanks to illegal tactics by Federal Bureau of Investigation agents during its investigation into Weather Underground activities, a federal grand jury declined to indict Ayers and other group members over the bombings and other illegal activities.
According to an examination of data from the Mississippi Center for Public Policy, Lawrence County had the highest two-year per capita average of fines and forfeitures in the state at $55.57.
Those numbers have a large caveat, skewed by $1.28 million in fines and forfeitures in 2016 after the sheriff’s department there earned $103,057 in fines and forfeitures in 2017.
In 2015, the county had fine and forfeiture revenues of $98,961 and $116,664 in 2014.
Tiny Issaquena County (population 1,308) was second, with a running two-year average over 2016 and 2015 of $36.10 in revenue from fines and forfeitures. The county received $45,468 in 2015 from fines and forfeitures and $48,971 in 2016.
In 2016, fines and forfeitures represented 1.06 percent of Issaquena County’s revenues ($4,583,342) and 1.02 percent of revenues ($4,423,202) in 2015.
The county with the largest population in the top five, Simpson, averaged $26.23 per each one of its 26,758 residents for fines and forfeitures for third place. In 2017, fines and forfeitures ($642,093) accounted for 7.84 percent of the county’s revenues. In 2016, fines and forfeitures ($697,283) represented 5.36 percent of the county’s $ 13,006,437 in revenues.
According to a 2018 audit by state Auditor Shad White’s office, the Simpson County Sheriff’s Office didn’t maintain documentation for purchase of information and evidence (PIPE) funds and didn’t deposit funds within one business day into the county’s bank accounts. The county said in its response to the report that it had corrected both deficiencies.
Fourth was Jefferson County, with a two-year average of $182,409 in fine and forfeiture revenues or $25.67 per resident. Fifth was Franklin County, with a two year average of $182,409 and a per capita figure of $25.38.
The auditor’s office conducts audits, either directly or via an accounting firms, of the state’s 82 counties periodically. Listed under each county’s revenues was a category for fines and forfeitures, which can include traffic and other fines and forfeitures. Most of the data was from the fiscal years 2017 and 2016.
The auditor’s office had data from those years for most counties, but 23 did not and data from 2016 and 2015 was substituted.
The average statewide for the state’s counties was $21.16 in fines and forfeiture revenue per resident and counties averaged $428,743 per year in revenue.
Sixteen Mississippi cities earned at least $1 million in fines and forfeitures and the average for residents in cities and towns was $32.54.
Sheriffs are prohibited by law in Mississippi from using radar for traffic enforcement, so it can be surmised that most of the fines and forfeitures listed in the county audits by the Office of the State Auditor are likely seizures.
| County | Population | 2017 fines and forfeitures | Per capita | 2016 fines and forfeitures | Per capita | Two-year forfeiture average | Per capita average |
| Lawrence | 12,455 | $ 103,057 | $ 8.27 | $ 1,281,190 | $ 102.87 | $ 692,124 | $ 55.57 |
| Issaquena* | 1,308 | $ 45,468 | $ 34.76 | $ 48,971 | $ 37.44 | $ 47,220 | $ 36.10 |
| Simpson | 26,758 | $ 706,546 | $ 26.41 | $ 697,283 | $ 26.06 | $ 701,915 | $ 26.23 |
| Jefferson | 7,106 | $ 254,787 | $ 35.86 | $ 110,030 | $ 15.48 | $ 182,409 | $ 25.67 |
| Franklin | 7,788 | $ 190,843 | $ 24.50 | $ 204,434 | $ 26.25 | $ 197,639 | $ 25.38 |
| Jones | 68,461 | $ 1,189,335 | $ 17.37 | $ 2,085,672 | $ 30.47 | $ 1,637,504 | $ 23.92 |
| Montgomery | 10,023 | $ 241,087 | $ 24.05 | $ 233,427 | $ 23.29 | $ 237,257 | $ 23.67 |
| Amite | 12,326 | $ 290,246 | $ 23.55 | $ 248,354 | $ 20.15 | $ 269,300 | $ 21.85 |
| Tunica | 9,944 | $ 193,928 | $ 19.50 | $ 238,460 | $ 23.98 | $ 216,194 | $ 21.74 |
| Lamar | 62,447 | $ 1,249,443 | $ 20.01 | $ 1,452,579 | $ 23.26 | $ 1,351,011 | $ 21.63 |
*Data from 2016 and 2015
In this episode of Unlicensed, we talk about our ongoing on audit of public higher education in Mississippi with the American Council of Trustees and Alumni.
Has anything like this been done before in Mississippi? Did this have anything to do with the chancellor search at Ole Miss? And what can we learn from it?