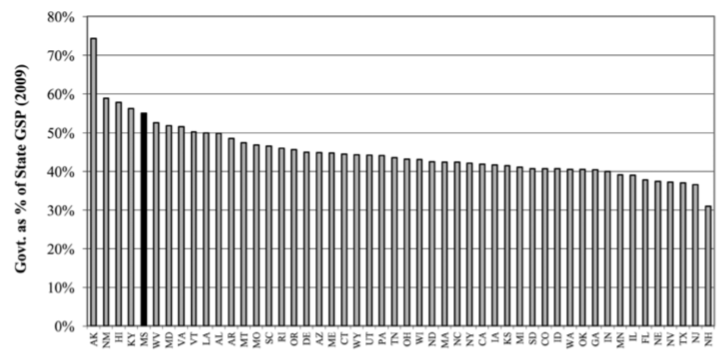
There are eight states where government controls more than half of the economy. Mississippi is one of them.
According to the Fraser Institute, government spending- federal, state, and local- accounts for 55 percent of the economy in Mississippi (as outlined in Promoting Prosperity in Mississippi). This leaves less than half of the state’s economic resources for the private sector. New Hampshire is the freest state, with just 31 percent of the economy controlled by the government. Live Free or Die indeed.

This ranking gave Mississippi the fifth largest government, behind Alaska, New Mexico, Hawaii, and Kentucky. Looking at our neighbors, government controlled between 47-50 percent of the economies in Alabama, Arkansas, and Louisiana. It is 43 percent in Tennessee.
For those that might blame federal spending, if we look at just state and local spending, Mississippi would actually move up to the fourth highest share of government control. So the federal government isn’t to blame.
Government is growing in Mississippi
Interestingly, it has not always been this way. Throughout the 1990s, government control of the economy in Mississippi ranged from about 40-45 percent.
It sat at around 45 percent at the turn of the century. And has been trending in the wrong direction since that time.
Does this matter?
Mississippi has an outsized government. It is larger than our peers. But do we need it? After all, Mississippi is a poor state and largely rural.
Regardless of the size of the state, it is problematic when resources must be dedicated to political favor seeking and lobbying rather than private sector activities. The shift is from entrepreneurship and toward lobbying. That may benefit an individual or a single company, but it does not benefit the economy.
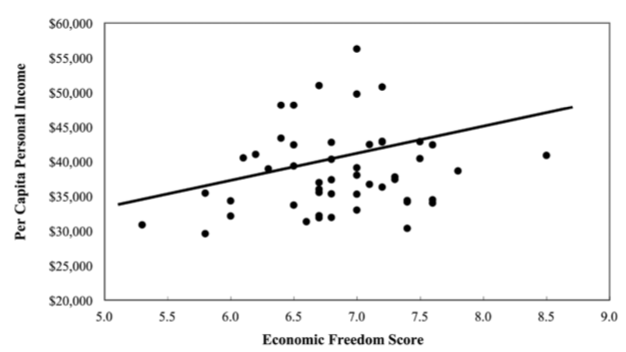
And we have data to show the correlation between economic freedom, which includes personal choice, voluntary exchange, free enterprise, and property rights, and prosperity.
When looking at the Economic Freedom of North America index and per capita income, we see a direct and clear trend. The freer the state, the greater the income.

Those who live in states with the highest per capita income live in the freest states. The poorest states rely on the government. It is not by accident.
People vote with their feet
Beyond the data and freedom indexes from the likes of Fraser, Cato, or Heritage, can you make the argument that people like the high regulation, union friendly status of states like California or New York? After all, Manhattan and San Francisco (minus the used needles and feces on the streets) are highly desirable places to live. And as a result, their cost-of-living is among the highest in the country.
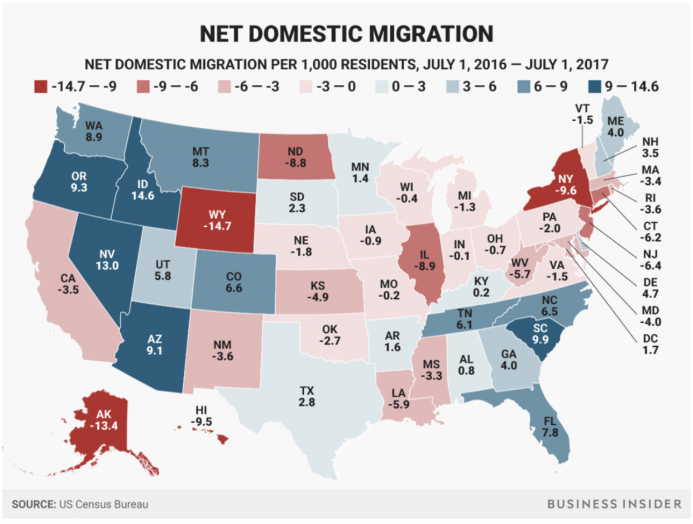
And while those locations might be desirable, net migration tells a different story. We can throw out the data, the policy wonks, and the studies and we still have this graphic.

We are free to live where we’d like in this country. And people are moving to the states that do well on the various measures of economic freedom. As a result, they are moving out of states that do not.
Do people intentionally look at these reports and determine that is where they are going to live? No, probably not. Rather, they are moving to the states with opportunity, with growth, and where the cost-of-living is reasonable. (Hint: states with less burdensome regulations.)
Here is the net migration between 2016 and 2017 among the five freest and five least free states, according to the Economic Freedom of North America index.
| State | Freedom Index Ranking | Net Migration |
| New Hampshire | 1 | 3.5 |
| Texas | 2 | 2.8 |
| Florida | 3 | 7.8 |
| South Dakota | 4 | 2.3 |
| Tennessee | 5 | 6.1 |
| Hawaii | 45 (tie) | -9.5 |
| Mississippi | 45 (tie) | -3.3 |
| New Mexico | 47 (tie) | -3.6 |
| West Virginia | 47 (tie) | -5.7 |
| California | 49 | -3.5 |
| New York | 50 | -9.6 |
The numbers speak for themselves. If we want to increase prosperity and attract new residents to the state, it starts with enacting policies that encourage and promote the principles of economic freedom.