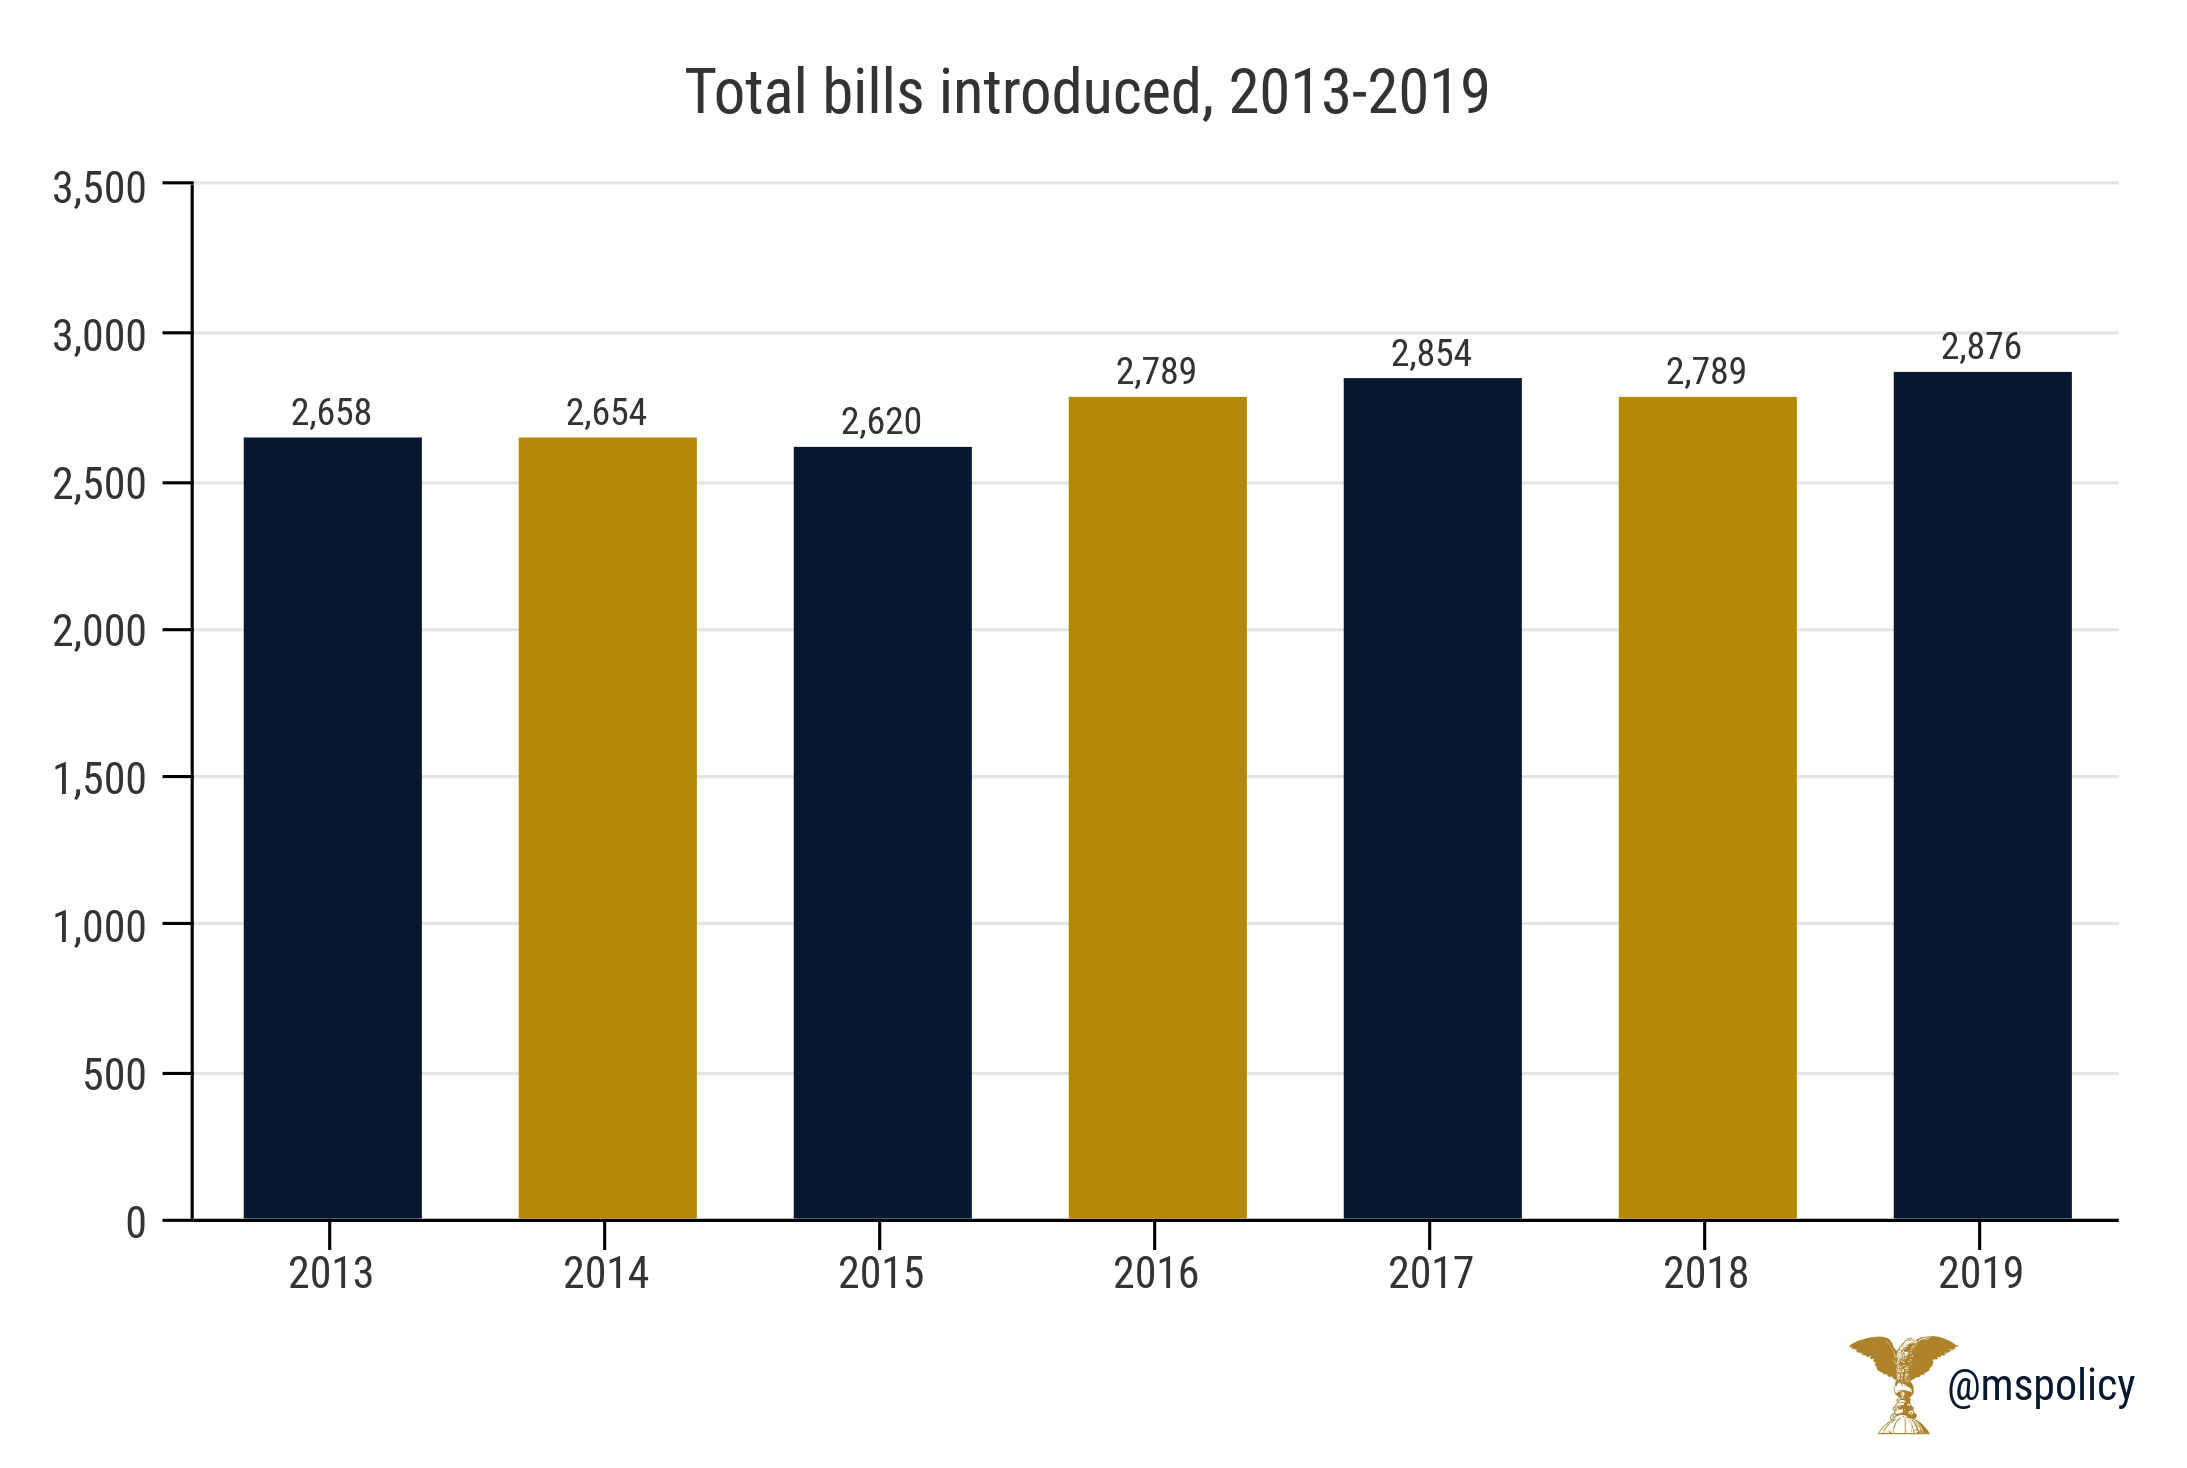
Despite the largest number of total bills presented in the last six years, the percentage of them that became law (12.66 percent) was the second lowest in the same span.

There were 2,876 bills — 127 more than the six-year average of 2,749 — that were drafted in this year’s session, which ended Friday. With 104 of them being appropriations bills — which fund state agencies and make up the budget — that left 2,772 general bills.
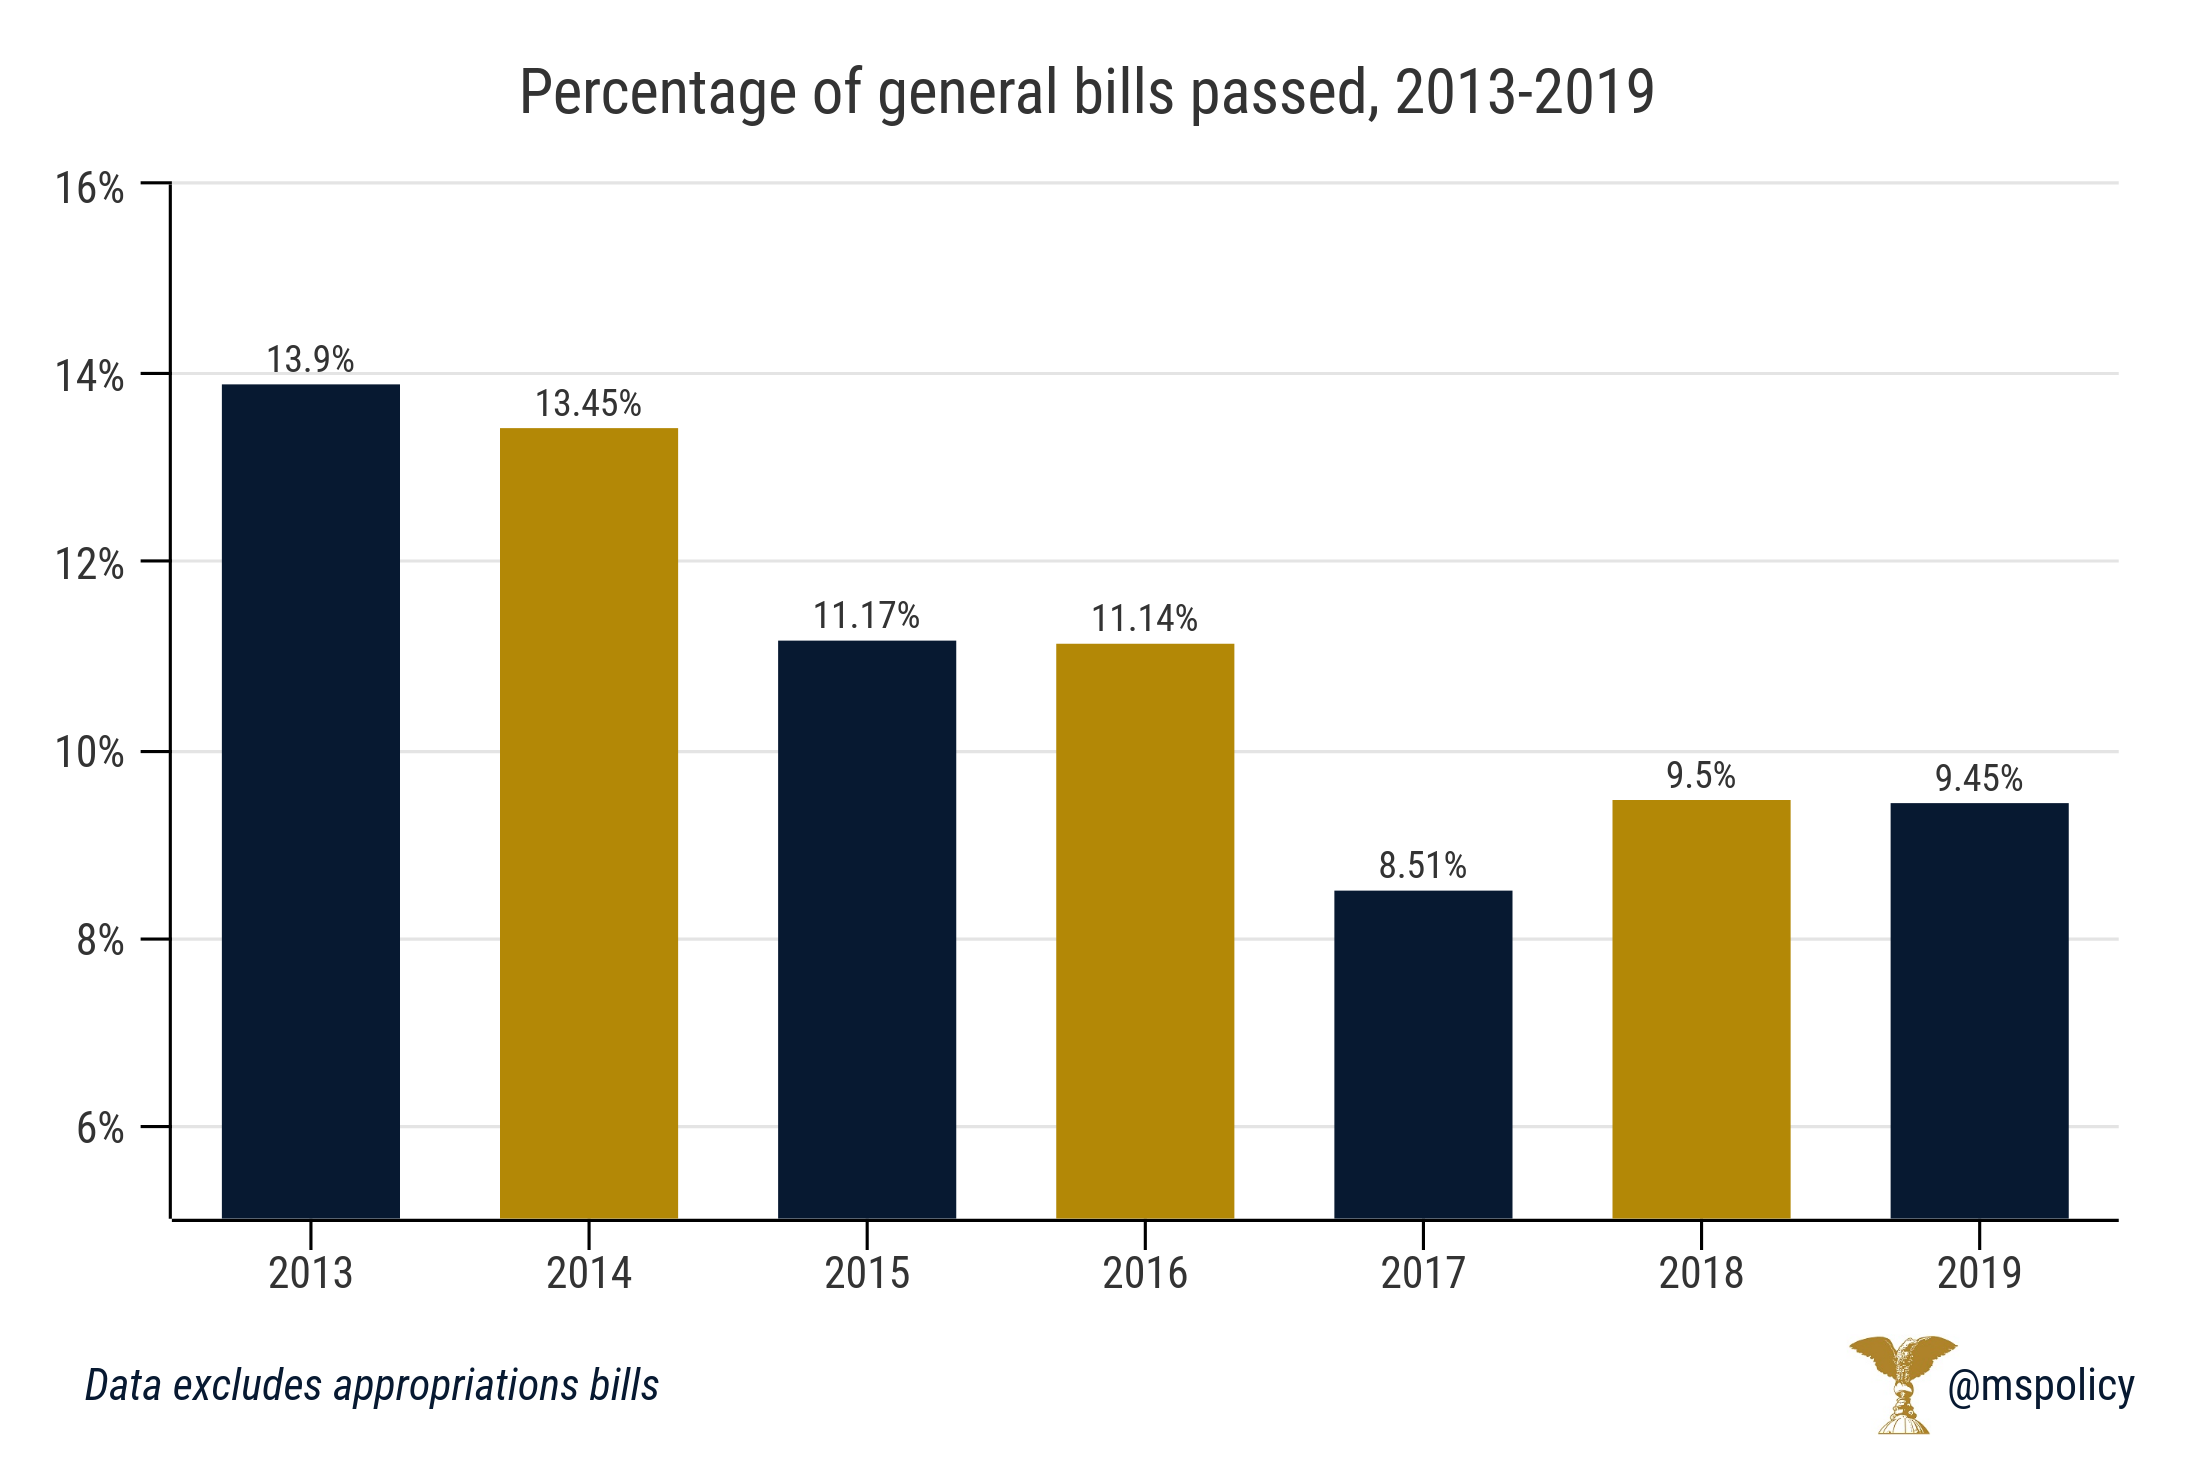
Only 260 general bills were passed by both chambers in the legislature and either have been signed or are awaiting the signature of Gov. Phil Bryant. That’s a rate of 9.45 percent for those keeping score at home.

Most bills signed into law by Bryant will go into effect on July 1, the first day of the new fiscal year.
The average in the last six years has been 11.01 percent for general bills and 14.38 percent for all bills.
Comparing the session with last year, 9.5 percent of all general bills and 12.87 percent of all bills in that session became law.
While the number of bills dropped has gone up in the last four years, the number that survive the process in the legislature to make it to the governor’s desk has shrunk every years since 2016.
The highest percentage session was 2013, when 17.27 of all bills and 13.9 percent of all general bills became law. That session had 2,658 total bills and 2,554 general ones.
The chances that this year’s bills passed by the legislature are signed by the governor are good. This session, Bryant vetoed only three out of 366 bills after averaging four vetoes per session the last three years.
Here are the bills Bryant vetoed in this year’s session:
| Session year | Total bills | Appropriations | General | All bills passed by both chambers | General bills passed by both chambers | % of total bills passed | % of general bills passed |
| 2019 | 2,876 | 104 | 2,772 | 366 | 262 | 12.73% | 9.45% |
| 2018 | 2,789 | 104 | 2,685 | 359 | 255 | 12.87% | 9.50% |
| 2017 | 2,854 | 104 | 2,750 | 338 | 234 | 11.84% | 8.51% |
| 2016 | 2,789 | 104 | 2,685 | 403 | 299 | 14.45% | 11.14% |
| 2015 | 2,620 | 104 | 2,516 | 385 | 281 | 14.69% | 11.17% |
| 2014 | 2,654 | 104 | 2,550 | 447 | 343 | 16.84% | 13.45% |
| 2013 | 2,658 | 104 | 2,554 | 459 | 355 | 17.27% | 13.90% |
| Averages | 2,749 | 2,645 | 394 | 290 | 14.39% | 11.02% |